
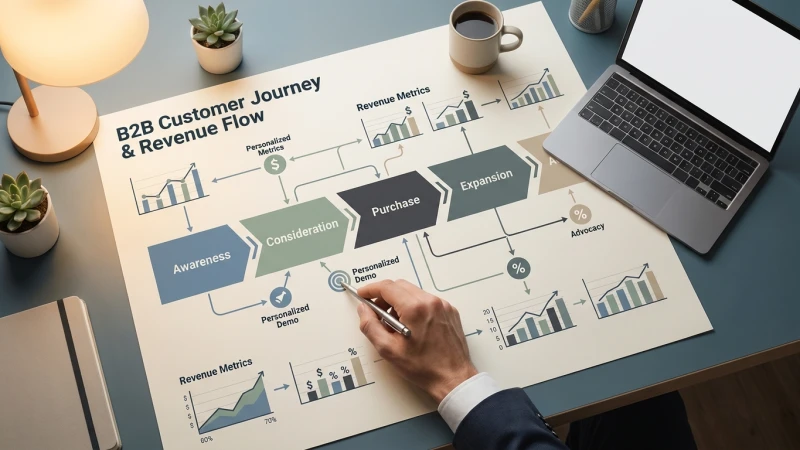
Companies with documented customer journey maps see a 54% higher marketing ROI, yet 68% of B2B organizations still rely on guesswork to understand their buyer’s path to purchase. That’s wasted time and missed revenue. The best approach is to connect journey touchpoints directly to revenue metrics and ROI measurement. In this article, you’ll gain a complete guide equipped with a 5-step framework to visualize and improve your B2B buyer’s path effectively.
What is B2B Customer Journey Mapping and Why Traditional Approaches Fail
B2B customer journey mapping isn’t just about plotting touchpoints. It’s about defining a strategic roadmap that impacts your bottom line. The reality is, 73% of these maps never get implemented due to gaps in connecting them with revenue outcomes. The cost? A staggering 23% revenue loss on average.
Understanding the differences between B2B and B2C journey mapping is important. While B2C focuses on emotional triggers, B2B journey mapping demands attention to complex decision-making processes and multiple decision-makers. Let’s break it down further:
|
Aspect |
B2B Journey Mapping |
B2C Journey Mapping |
|
Decision-Making |
Multiple decision-makers, committee decisions |
Individual decisions, emotional factors |
|
Sales Cycle |
Long, complex, stages with negotiations |
Shorter, simpler, impulse-driven |
|
Touchpoints |
Numerous, personalized and segmented |
Fewer, broad and generalized |
A real-world case study highlights how a leading SaaS provider documented a B2B journey map but failed to integrate it with their CRM system. Result? Customer churn increased by 15% due to neglected touchpoints.
The Revenue-Impact Journey Mapping Framework: 7 Stages That Drive Results
The REVENUE framework is the cornerstone of effective customer journey mapping in B2B. This structure not only outlines the buyer’s path but also integrates each stage with your sales pipeline to drive measurable business outcomes. Let’s dive into it:
Assigning dollar values to each touchpoint is critical. Start by evaluating the cost of conversion at each stage and align it with the potential revenue it could generate. Here’s a quick breakdown of the stages:
|
Stage |
Key Activities |
Conversion Metrics |
|
Recognition |
Brand awareness, lead acquisition |
CTR, CPL |
|
Engagement |
Content interaction, webinar participation |
Engagement rate, MQL |
|
Validation |
Case study review, demo requests |
Demo requests, SQL |
|
Evaluation |
Negotiations, proposal reviews |
Win rate, ACV |
|
Negotiation |
Contract sign-off, pricing discussions |
Close rate, deal size |
|
use |
Onboarding, initial use |
Customer satisfaction score |
|
Expansion |
Upsell, cross-sell |
Renewal rate, LTV |
By integrating these stages with your existing sales pipeline, you can assign KPIs to each, ensuring every touchpoint contributes to a specific business outcome.
Advanced Touchpoint Mapping: Beyond Basic Contact Points
Mapping touchpoints isn’t just about listing emails and calls. It’s about identifying hidden influencers such as the finance, legal, and IT departments that can make or break a deal. Let’s explore these:
Integrating digital and offline touchpoints is key. This includes everything from social media interactions to face-to-face meetings. To ensure complete mapping, use the following touchpoint audit checklist:
|
Department |
Touchpoint |
Influence Score |
|
Finance |
Budget approval meetings |
85 |
|
Legal |
Contract review sessions |
90 |
|
IT |
Security assessment discussions |
75 |
Touchpoint influence scoring helps prioritize which interactions need more attention. Use a scale of 1 to 100 to determine which departments have the most impact on the buyer’s decision.
Data Collection and Research Methods for Accurate B2B Journey Maps
Accurate journey mapping begins with rigorous data collection. You need both qualitative and quantitative insights. Primary research methods like interviews and surveys should be your start point.
|
Method |
Purpose |
Sample Size |
|
Interviews |
In-depth insights, qualitative data |
15-30 decision-makers |
|
Surveys |
Quantitative data, trend identification |
100+ respondents |
|
Observations |
Behavioral insights, process validation |
10-20 sessions |
Secondary data sources also play a role. CRM systems, marketing automation tools, and support tickets provide a wealth of information. Here’s how long B2B sales cycles affect research:
Long sales cycles require periodic data collection to capture changes over time. Create a timeline template to organize data collection every quarter to ensure accuracy.
Creating Your B2B Customer Journey Map: Step-by-Step Process
Ready to create your map? Begin with pre-mapping preparation by aligning your team and gathering necessary data. Here’s a step-by-step checklist:
- Align cross-functional teams: Marketing, Sales, Customer Support
- Collect and analyze preliminary data: CRM, interviews
- Define journey stages: Use this framework
- Validate with decision-makers: Ensure all key players agree
- Visual mapping: Use tools like Lucidchart or Miro
Pain point identification is important. Use a pain point prioritization matrix to address the most effective issues first. Download a journey map template to get started.
improve the B2B Buyer Journey: Proven Tactics That Increase Conversions
improve is where strategy meets execution. Reducing friction at each stage of the journey is key. Here’s how:
|
Stage |
improve Tactic |
Expected Improvement |
|
Recognition |
Revamp ad targeting with retargeting strategy |
40% more conversions |
|
Engagement |
Content mapping: align with buyer needs |
25% higher engagement |
|
Validation |
Improve demo follow-ups with personalized emails |
20% higher MQL to SQL conversion |
Content audits ensure your material meets customer needs at each stage. Integrate SEO audit practices to boost visibility and engagement.
Measuring and Iterating Your Journey Map: KPIs and Success Metrics
The final piece of the puzzle is measurement. Define journey-specific KPIs to track progress. Use the following template to get started:
|
Stage |
KPI |
|
Recognition |
Brand reach, lead volume |
|
Engagement |
Content interaction rate |
|
Evaluation |
Proposal acceptance rate |
Attribution modeling helps identify which touchpoints drive ROI. Regular reviews, every six months, ensure your map stays relevant. Employ A/B testing to validate journey improvements, adjusting as necessary to increase effectiveness.
Ready to change your customer journey mapping practices into a revenue-generating machine? Begin today by implementing the REVENUE framework. For more insights, explore our Ultimate Guide to Marketing Automation and ABM Playbook. The future belongs to those who innovate and measure. Make sure you’re one of them.
FAQs
What is customer journey mapping in B2B? Customer journey mapping in B2B is a strategic approach to visualizing the buyer’s path from awareness to purchase, influencing multiple decision-makers along the way. It aims to improve the buyer experience and directly tie touchpoints to revenue. How to create a B2B customer journey map? Begin by aligning your team, collecting relevant data, and defining journey stages. Use visual mapping tools for clarity and validate stages with decision-makers. Prioritize pain points and ensure all touchpoints are mapped accurately. What’s the difference between a customer journey and buyer journey? The customer journey encompasses the entire experience with a brand, including post-purchase interactions. The buyer journey focuses on the pre-purchase phase, detailing the path a prospect takes before becoming a customer. How long does it take to create a B2B customer journey map? Creating a B2B customer journey map can take anywhere from a few weeks to several months, depending on the complexity of the sales cycle and the availability of data. It’s important to periodically update and refine the map.