
73% of B2B companies invest in customer journey mapping, yet only 23% see measurable revenue acceleration. The gap is staggering because many treat journey maps as static diagrams rather than dynamic tools that drive pipeline velocity. In this article, you’ll learn about a data-driven framework that distinguishes successful B2B journey maps from those that fail to impact growth. Expect to walk away with a 5-stage framework, touchpoint mapping tools, and an improve playbook to ensure your efforts translate into accelerated revenue.
Why 73% of B2B Customer Journey Maps Fail to Drive Revenue Growth
Most B2B journey mapping initiatives don’t impact revenue growth because they miss the mark in execution. According to a study, 73% of companies engage in customer journey mapping, but only 23% experience significant ROI. The failure? It’s in the details.
Common mistakes include vague personas, lack of practical data, and a disconnect between sales and marketing. Let’s lay out a clear failure rate comparison table to see why most maps don’t deliver.
| Mapping Outcome | Percentage of Companies |
| Successful Revenue Growth | 23% |
| No Significant Impact | 50% |
| Negative ROI | 27% |
The best approach to correct these pitfalls is an ROI impact framework that aligns with key business objectives. Imagine shifting from a static map to a proactive tool, one that continuously informs your strategy and adjusts with real-time data. Imagine your SDR team using this map to prioritize leads that align with high-revenue paths. If you fix these gaps, you’re not just drawing a map; you’re crafting a GPS for growth.
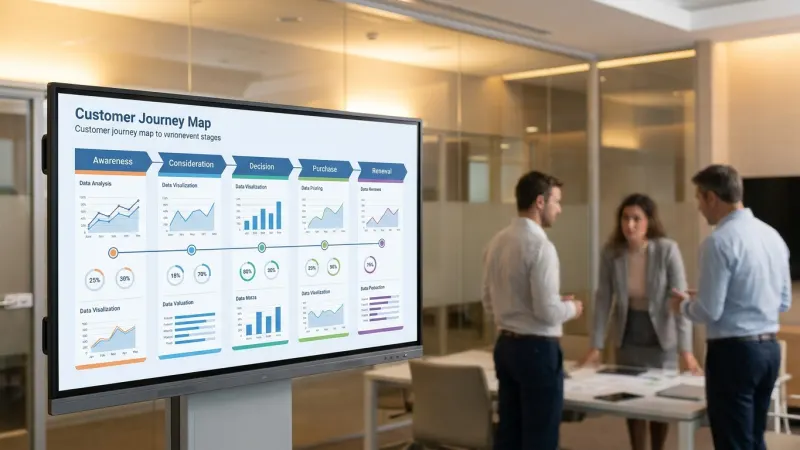
The 5-Stage B2B Customer Journey Framework (With Conversion Benchmarks)
Rather than creating a generic map, a definitive 5-stage B2B customer journey framework can be change. This framework is anchored in data with benchmarks to guide every stage.
Let’s break it down piece by piece:
| Stage | Conversion Rate Benchmark | Time-to-Move Benchmark |
| Awareness | 20% | 7 Days |
| Consideration | 15% | 14 Days |
| Decision | 10% | 21 Days |
| Purchase | 5% | 7 Days |
| Renewal | 25% | 30 Days |
Velocity calculations are important here. For instance, if the Awareness stage conversion doesn’t hit 20% within 7 days, your pipeline velocity is at risk. A 5% lag in the Decision stage might seem minor, but it’s a revenue bottleneck that extends your sales cycle by weeks. The goal is clear: tighten these metrics to accelerate your pipeline velocity.
Touchpoint Mapping: The 23 Critical B2B Interaction Points You Can’t Miss
Here’s a hard truth: most B2B companies neglect critical touchpoints. This isn’t about listing channels; it’s about use each interaction point as a conversion opportunity.
Let’s explore the complete touchpoint taxonomy.
- Email Engagement
- Webinar Participation
- White Paper Downloads
- Website Visits
- Social Media Interactions
- Direct Sales Calls
- Customer Support Contacts
- Live Chat Engagement
- CRM Entry
- Product Demo Requests
- Event Attendance
- Content Engagement
- Case Study Access
- Referral Visits
- Trial Sign-up
- Customer Reviews
- Blog Comments
- PR Mentions
- Testing Feedback
- Newsletter Subscriptions
- Partnership Interactions
- Community Engagement
- Video Views
Each touchpoint must be scored based on influence. For example, Account-Based Marketing shows us direct sales calls may carry more weight than social media interactions in influencing a purchase decision. Align your scoring with revenue impact.
Data Collection Strategy: How to Gather Journey Intelligence That Actually Matters
Data collection isn’t just about gathering; it’s about quality. Multi-source data collection must be strategic, pulling insights from diverse channels beyond traditional surveys.
To collect meaningful data, use the following data source priority matrix:
| Data Source | Priority Level | Data Quality Score |
| CRM Data | High | 9/10 |
| Web Analytics | Medium | 7/10 |
| Social Media Analytics | Medium | 6/10 |
| Direct Surveys | Low | 5/10 |
Consider using journey analytics tools for deeper insights. Cross-validate data sources to ensure reliability. A CRM system combined with web analytics provides a fuller picture than either could alone.
The Journey Mapping Workshop: 4-Hour Process to Build Your First Map
Successful journey mapping requires action, not theory. A structured workshop ensures all decision-makers contribute and align. Here’s a quick agenda:
- Hour 1: Introduce Journey Mapping and Objectives
- Hour 2: Identify Key Personas and Pain Points
- Hour 3: Map Out Stages and Touchpoints
- Hour 4: Review and Assign Action Points
Prepare by setting clear roles. Use a Sales Enablement Content Framework to guide content discussions. decision-makers alignment is important, so assign responsibility for each part of the journey.
improve Playbook: 12 Proven Tactics to Accelerate Journey Velocity
Velocity is the name of the game. Not all tactics are created equal, and here are 12 you can’t ignore:
- Implement targeted B2B retargeting strategies
- A/B test email subject lines for higher opens
- Use predictive lead scoring for prioritization
- Shorten forms on landing pages
- use chatbots for immediate engagement
- Automate follow-up sequences in marketing automation tools
- Custom-tailor content for different stages
- Reduce decision friction with user reviews
- improve ad spend through precise targeting
- Improve CRM integration
- Strengthen cross-departmental collaboration
- Regularly analyze and clean your data
A/B testing frameworks should be in place. For example, testing retargeting ads using the SCALE Framework can improve ad performance and contribute to faster journey velocity.
Measuring Success: KPIs and Attribution Models for Journey ROI
Measurement is often overlooked, but critical. Define journey-specific KPI frameworks like customer satisfaction scores, conversion rates, and time to close deals.
Use the following KPI tracking template:
| KPI | Current Value | Target Value |
| Customer Satisfaction | 85% | 90% |
| Conversion Rate | 3% | 4% |
| Sales Cycle Time | 45 Days | 30 Days |
Attribution models for multi-touch journeys can help you understand touchpoint effectiveness. Implement ROI calculation methodologies to prove journey mapping’s impact on revenue.
FAQ
What is customer journey mapping in B2B? Customer journey mapping in B2B involves visualizing the steps a business customer takes from awareness to purchase and beyond. It focuses on understanding customer interactions across multiple touchpoints to improve the buying experience and speed up the sales cycle, thus driving revenue growth. How to create a B2B customer journey map? To create a B2B customer journey map, define your customer personas, identify their pain points, and map out stages in their buying process. Include key touchpoints and use data to inform each stage. Regularly update the map to reflect changes in customer behavior and market conditions. What’s the difference between B2B and B2C customer journey mapping? B2B customer journey mapping focuses on longer sales cycles, multiple decision-makers, and complex touchpoints compared to B2C, which typically involves shorter cycles and individual decision-making. B2B journeys require more detailed mapping of interactions and data-driven strategies. How long does it take to see results from journey mapping? Results from journey mapping can vary, but many B2B companies begin to see measurable improvements in pipeline velocity and revenue growth within 3 to 6 months. The key is continuous improve and alignment with sales and marketing efforts.
Take action now, map your first journey today. Explore our Valasys MarTech Blog to discover more about accelerating your pipeline. Within six months, I predict that companies that implement these strategies will see a noticeable uptick in both pipeline velocity and closed revenue. Dive in and start mapping the journey that will take your business to new heights.