
73% of B2B companies create customer journey maps, but only 27% use them to drive actual revenue growth. This disconnect leaves a staggering $2.4 million in lost opportunities on the table annually for average-sized companies. You’re about to discover the data-driven framework that closes this gap by change static maps into dynamic tools for growth. In this guide, we’ll walk through a practical 5-step framework, industry-specific templates, and measurable improve techniques. If you’re ready to turn your maps from theoretical exercises into real revenue drivers, let’s dive in.
The $2.4M Problem: Why 73% of B2B Journey Maps Sit Unused in Folders
Imagine crafting a detailed customer journey map only to have it languish in a forgotten folder. That’s the fate of many maps. The average company loses nearly $2.4 million annually by not actively using their journey maps to drive revenue. Traditional maps often fail because they’re static snapshots in a highly dynamic buying environment. They capture a moment rather than reflect ongoing patterns and changes.
Static maps become obsolete as soon as they’re created because they don’t account for real-time buyer behavior, multi-channel interactions, or rapid changes in market conditions. The difference between mapping and improve is the critical factor. Mapping charts the course; improve ensures you reach the destination with increased conversion rates.
| Company Size | Average Revenue Loss | Potential Gain with improve |
| Small (10-50 employees) | $200,000 | $300,000 |
| Medium (51-250 employees) | $1,000,000 | $1,500,000 |
| Large (251-1000 employees) | $2,400,000 | $3,600,000 |
Effective journey improve integrates real-time data with decision-driving insights, marrying the art of mapping with the science of improve. For example, incorporating intent data can boost B2B retargeting strategies by 40%, as detailed in our extensive guide on conversion frameworks.
B2B vs B2C Journey Mapping: The 5 Critical Differences That Change Everything
Understanding the fundamental distinctions between B2B and B2C journey mapping can save you from costly missteps. Unlike B2C, where a single decision-maker often acts quickly, B2B involves lengthy cycles and multiple decision-makers. B2B purchases are rarely impulsive; they’re strategic and prolonged, often spanning 6 to 18 months. Here’s how these differences stack up:
| Characteristic | B2B | B2C |
| Decision Makers | Multiple (3-16 people) | Single |
| Buying Cycle | 6-18 months | 1 day – 2 weeks |
| Buying Motive | Strategic need | Emotional desire |
| Sales Process | Complex | Simple |
| Influence Factors | ROI, value, service | Price, brand, reviews |
In B2B, you’re often dealing with committees where consensus is king. Each member has their agendas and reservations, which can make the process push and pull-centric. Here, account-based marketing strategies can be pivotal, aligning efforts to influence multiple decision-makers effectively.
The DRIVE Framework: 5-Step Process for Data-Backed B2B Journey Maps
The DRIVE framework represents a complete, five-step process designed to change how you create and use B2B journey maps. It integrates real-time buyer data into every step, ensuring relevance and effectiveness.
1. Discover: Data Collection Methods
Start by gathering data from every customer interaction. Use marketing automation tools for capturing touchpoints and customer feedback tools for qualitative insights. Consider platforms that handle over two million leads monthly to ensure scalability.
2. Research: decision-makers Interviews
Conduct interviews with sales, marketing, and customer service teams. Aim for a 360-degree view of customer interactions, identifying common pain points and successes. This step help your journey with internal insights.
3. Identify: Touchpoint Audit
A complete audit of customer touchpoints reveals where prospects drop off. Use analytics tools to monitor behavior and pinpoint friction points. Our Sales Enablement Content Framework can simplify touchpoints effectively.
4. Visualize: Mapping Techniques
Map these insights onto a customer journey template. use visualization software that allows for dynamic updates. Templates that automatically integrate with your CRM ensure current and applicable maps, as explored in our MarTech stack guide.
5. Execute: improve Tactics
This is where many fall short. Use A/B testing on mapped touchpoints to measure effectiveness. Implement predictive analytics to anticipate customer needs. This approach ensures you’re not just mapping but continuously improving the journey.
Following the DRIVE framework means turning your customer journey map into a living document, one that evolves with every customer interaction and market shift.
Industry-Specific Journey Templates: SaaS, Manufacturing, and Professional Services
Stop using generic journey templates that don’t fit your industry needs. Here are three ready-to-use templates tailored for SaaS, Manufacturing, and Professional Services sectors.
SaaS: Free Trial to Enterprise Conversion Paths
SaaS business models thrive on trials converting into subscriptions. This journey maps the path from initial trial signup to enterprise solution adoption, highlighting touchpoints like onboarding emails and feature usage alerts.
Manufacturing: RFP-Heavy Procurement Journeys
A typical manufacturing journey involves multiple RFP touchpoints before closing a deal. This template emphasizes detailed information exchange and long-term relationship management, important in achieving successful procurement.
Professional Services: Relationship-Driven Sales Cycles
For professional services, relationships often precede sales. This map focuses on building trust through expert content, regular check-ins, and high-touch service, ensuring clients see the long-term value.
These industry-specific templates offer a concrete starting point, but remember to customize them with your unique data and insights.
Touchpoint Mapping Technology: Tools That Actually Track B2B Buyer Behavior
Collecting data on every customer interaction is challenging unless you have the right tools. Here’s a look at technologies that enable effective touchpoint mapping.
Marketing Automation Integration
Platforms like HubSpot or Salesforce can integrate touchpoint data smooth, capturing every customer interaction across channels. For a clear comparison of these platforms, see our Salesforce vs HubSpot CRM guide.
Sales Enablement Platforms
These platforms help in aligning sales and marketing efforts, ensuring every lead is nurtured efficiently. Check our guide on Sales Enablement Content Framework for more insights.
Customer Feedback Tools
Gathering customer feedback is critical for improve. Use tools that offer both qualitative and quantitative analysis to refine your customer journey maps continuously.
| Tool | Features | Pricing | Use Case |
| HubSpot | CRM integration, automation | Free – $3,200/month | End-to-end journey management |
| Salesforce | Advanced analytics, customization | $25 – $300/user/month | Large-scale data handling |
| Qualtrics | Feedback and analysis | Custom pricing | Customer feedback refinement |
Implementing these tools ensures you’re not just collecting data but using it to inform and improve every aspect of the customer journey.
improve Playbook: 12 Proven Tactics That Increase Journey Conversion by 40%
improve is where strategy meets execution. Implement the following tactics to increase your journey conversion rates by up to 40%.
1. Content Gap Analysis
Identify and fill the gaps in your content strategy to ensure consistent messaging. This tactic alone can boost engagement significantly.
2. Handoff improve
Smooth transitions between marketing and sales teams can cut down on lead leakage. Review our ABM Sales-Marketing Alignment playbook for strategies.
3. Personalization Triggers
Use data to personalize outreach and interactions, increasing the relevance and impact of each touchpoint.
4. Friction Point Elimination
Identify points where customers drop off and simplify those processes. This reduces barriers and improves the overall customer experience.
These tactics are not mere suggestions; they’re proven strategies backed by data, ensuring that your efforts translate into tangible results.
Measuring Success: KPIs and Attribution Models for Journey Performance
Now that your customer journey is improve, how do you measure success? Here’s a breakdown of key performance indicators (KPIs) and attribution models to track the impact of your efforts.
Leading vs Lagging Indicators
Focus on leading indicators like engagement rates and customer satisfaction scores to anticipate future performance. Lagging indicators such as revenue and customer retention offer a retrospective view.
Multi-Touch Attribution
Use multi-touch attribution models to accurately credit each touchpoint’s contribution to a sale. This approach offers a complete view of what’s working.
Journey Velocity Metrics
Measure the speed at which prospects move through the journey. Faster velocity often indicates smoother processes and better alignment.
ROI Calculation Methods
Calculate the return on investment by comparing costs against revenue generated. This gives clear insights into the financial benefits of your efforts.
| KPI | Benchmark | Calculation Formula |
| Customer Satisfaction | 80% | (Positive Feedback / Total Feedback) * 100 |
| Lead Conversion Rate | 2-5% | (Converted Leads / Total Leads) * 100 |
| Customer Lifetime Value | $10,000 | Average Purchase Value * Purchase Frequency |
Adopting these measurement practices ensures that you have a clear, data-driven view of how your customer journey mapping efforts are paying off.
Conclusion
It’s time to stop leaving potential revenue locked in unused journey maps. Today, take the first step by applying the DRIVE framework to your B2B customer journey mapping processes. This isn’t just about mapping the path; it’s about improve every step to move your bottom line. Check out our resources on programmatic advertising and proving marketing ROI for further insights on driving growth. Embrace this approach to ensure your customer journey maps are not just accurate but powerful tools in achieving sustained business success.
By integrating real-time data and improve continuously, you’ll not only keep pace with the market but set the standard for others to follow. Your journey map is your business map, ensure it’s leading you towards success.
FAQ
What is customer journey mapping in B2B?
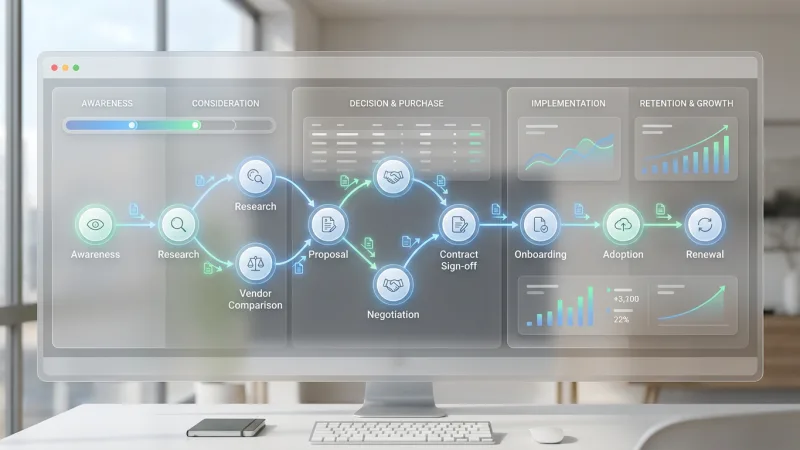
Customer journey mapping in B2B is the process of visualizing the various stages a business buyer goes through, from initial awareness to purchase and beyond. It involves tracking all touchpoints and interactions to improve the buying experience and improve conversion rates.
How to create a B2B customer journey map?
To create a B2B customer journey map, start by collecting data on all customer interactions. Follow with decision-makers interviews to gather insights. Conduct a touchpoint audit, then visualize these insights on a dynamic map. Finally, improve continuously using real-time data.
What’s the difference between B2B and B2C customer journey mapping?
B2B journey mapping involves multiple decision-makers and longer buying cycles, often 6-18 months, compared to B2C’s quick, individual decision-making processes. B2B focuses on strategic needs and ROI, while B2C often relies on emotional and immediate wins.
How long does it take to create a B2B customer journey map?
Creating a B2B customer journey map can take anywhere from a few weeks to several months, depending on the complexity of your business processes and the depth of data analysis required. It’s an ongoing process that should evolve with changing buyer behaviors.
What tools do I need for B2B customer journey mapping?
important tools for B2B customer journey mapping include CRM platforms like Salesforce or HubSpot, marketing automation tools, customer feedback systems, and analytics software. Each tool contributes to capturing and analyzing the multifaceted customer journey.